Financials take the lead.
No changes in the composition of the top 5 this week, and only one change of position within the top 5.
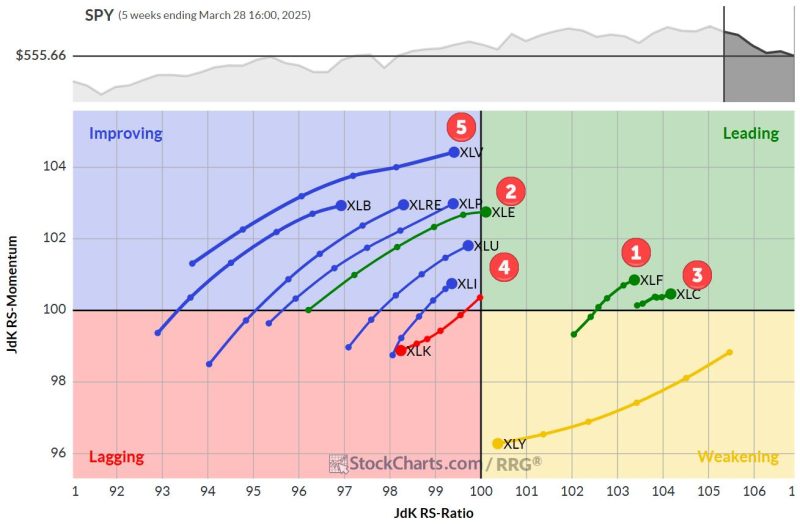
Financials (XLF) leapfrogged to the number one position, sending Communication Services (XLC) to the #3 position. Energy (XLE) remains #2 while Utilities (XLU) and Healthcare (XLV) remain in positions #4 and #5.
Let’s examine the details and see what the Relative Rotation Graphs tell us about the current market dynamics.
Sector Lineup
- (3) Financials – (XLF)*
- (2) Energy – (XLE)
- (1) Communication Services – (XLC)*
- (4) Utilities – (XLU)
- (5) Healthcare – (XLV)
- (6) Industrials – (XLI)
- (7) Consumer Staples – (XLP)
- (8) Real-Estate – (XLRE)
- (9) Consumer Discretionary – (XLY)
- (10) Materials – (XLB)
- (11) Technology – (XLK)
Weekly RRG: A Tale of Three Leaders
The weekly Relative Rotation Graph now shows three sectors firmly planted inside the leading quadrant.
XLF has rotated back into leadership after a brief sojourn, while Communication Services (XLC) maintains its strong position. Energy (XLE) is the latest entrant, crossing over into leading with a positive RRG heading—a trajectory that bodes well for continued outperformance.
Utilities (XLU) and Health Care (XLV)—our fourth and fifth-ranked sectors—currently reside in the improving quadrant. However, their strong RRG headings suggest they’ll likely leap into leading territory in the coming weeks. It’s worth noting that Health Care is flexing its muscles with the highest RS momentum value among all 11 sectors.
On the flip side, we’re seeing only two sectors with negative RRG headings—the same culprits as last week. Technology (XLK) is pushing further into the lagging quadrant, while Consumer Discretionary (XLY) is rapidly approaching a crossover from weakening to lagging. This persistent weakness in these typically high-flying sectors is something to keep an eye on as it coincides with general market weakness.
Daily RRG: Short-Term Shifts
Zooming in on the daily RRG, we get a more nuanced picture of short-term rotations. Financials are holding steady in the leading quadrant with a neutral heading—there has been little movement over the past week.
Energy, which boasts the highest RS ratio, is losing some momentum. However, given its elevated RS ratio, this is likely just a temporary setback.
Utilities and Health Care are showing some interesting moves on the daily chart. XLU is currently in the weakening quadrant with a negative heading, but XLV is starting to curl back up—a positive sign that aligns with its weekly chart momentum.
XLC’s daily tail is painting an intriguing picture. It’s barely inside the lagging quadrant, but its positive heading pointing towards leading suggests it may soon start supporting the positive direction we see on the weekly chart.
In the bottom half of the rankings, we see some weekly weakness confirmations. Technology is rolling over in the improving quadrant, while sectors like industrials and materials are rotating from leading to weakening, all of which aligns with their lower positions in the portfolio ranking.
Financials (XLF)
XLF has bounced off support around 47, but the price chart still looks precarious.
The relative strength picture, however, is much more encouraging. We’re seeing a clear uptrend in the raw RS line, which is pulling both RRG lines higher. Keep an eye on that 47 level as key price support.
Energy (XLE)
Energy is currently trading in a range between roughly 84-85 and 98.
The real action is in the relative strength- we’re seeing a breakout from a falling channel, which is now pulling both RRG lines above 100.
This is what’s driving XLE’s move into the leading quadrant.
Communication Services (XLC)
XLC is holding above support around 94, but only just.
A break below 93-94 could trigger more downside.
Relative strength still looks good, but the raw RS line is at the top of its rising trend channel. The high RS ratio reading gives some wiggle room, but it’s a situation to monitor closely.
Utilities (XLU)
Utilities remain stuck in a trading range, which is keeping its raw RS line range-bound as well.
It’s strong enough to keep the RRG lines rising, but we’ll need to see a relative strength breakout to push XLU into the leading quadrant.
Health Care (XLV)
Health Care is bumping up against resistance near 150 and remains range-bound.
A potential head-and-shoulders pattern is forming, but support is still a ways off around 135.
Relative strength is pushing against resistance, and with both RRG lines rising, XLV looks poised to cross into the leading quadrant soon.
Portfolio Performance Update
After last week’s hiccup, the RRG portfolio has not only erased its underperformance but actually flipped to outperformance.
As of last week, the portfolio stands at -4.86% YTD, compared to the S&P 500’s -4.96%. That’s a reversal from a 1.4% underperformance to a 10 basis point outperformance — not too shabby for a week’s work.
The market is sending plenty of mixed signals, but the sector rotation story is becoming clearer. Financials are stepping up, Energy is making moves, and the traditionally defensive sectors are showing strength. Meanwhile, Tech and Consumer Discretionary continue to lag—a trend that could have significant implications if it persists.
These rotations can shift quickly, so stay nimble and keep your eyes on the charts. The market never sleeps, and neither should your analysis.
#StayAlert –Julius

