Sport Investors League
  • Politics
  • Stocks
  • Investing
  • Business

Sport Investors League

  • Politics
  • Stocks
  • Investing
  • Business
Stocks

TLT Turns the Corner and Starts to Lead

by admin August 10, 2024
August 10, 2024
TLT Turns the Corner and Starts to Lead

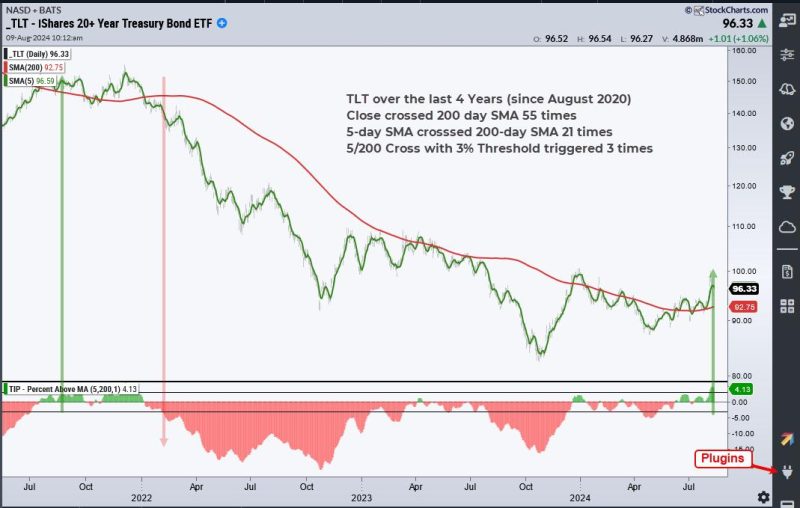
The 20+ Yr Treasury Bond ETF (TLT) is turning the corner as a long-term trend indicator turns bullish and price extends on a breakout. TLT is also starting to outperform the S&P 500 EW ETF (RSP), for the first time in a long time.

The first chart shows TLT with the 5-day SMA (green), the 200-day SMA (red) and the Percent above MA (5,200,1) in the lower window. This indicator shows the percentage difference between the 5 and 200 day SMAs. Note that I placed signal thresholds at +3% and -3%. This means I want the 5-day SMA to be at least 3% above/below the 200-day SMA for a signal.

We cannot totally eliminate whipsaws, but we can reduce them with smoothing and signal thresholds. In the window above, we can see the indicator turning green and red as the 5-day crosses above/below the 200-day. There were at 21 crosses over the last four years. There were only three crosses using the 3% signal thresholds. Note that a 3% signal triggers with a move above 3% and remains valid until a move below -3%. Percent above MA(5,200,1) exceeded +3% this week to signal the start of a long-term uptrend. Note that Percent above MA is one of 11 indicators in the TIP Indicator Edge Plugin (here).

As featured at TrendInvestorPro, the next chart shows TLT with some classic technical analysis at work, and a breakout to boot. First, TLT surged some 22% from late October to December. It then declined with a falling channel that retraced around 2/3 of this advance. TLT managed to hold well above the October low and break out of the channel. This higher low shows buying pressure stepping in at higher prices (above the October low). The breakout signals a continuation of the 22% advance and targets a move to the next resistance zone (109). Support is set at 90.

We are also seeing TLT outperform the S&P 500 EW ETF (RSP) for the first time in over a year. The indicator window shows the TLT/RSP ratio flattening out in spring-summer and breaking above its June high (red line). It also broke the 200-day SMA. Admittedly, the relative breakout is still a work in progress. The breakout on the price chart, however, looks solid.

We featured the breakout in TLT over a week ago and will continue to monitor it at TrendInvestorPro. This week we covered the significance of a surging VIX and widening yield spreads. We also covered deteriorating breadth and put forth a target zone for SPY going forward. Click here for immediate access.

//////////////////////////////////////////////////

0
FacebookTwitterGoogle +Pinterest
previous post
How the PROS Time Entry Points
next post
Stocks close higher, clawing back some losses from Monday’s sell-off

Related Posts

Will USO Soar to $83? Here Are the...

August 8, 2024

The Best Five Sectors, #14

April 6, 2025

IT Breadth Momentum (ITBM) and IT Volume Momentum...

February 8, 2025

NVDA Stock Split Launches S&P 500 Higher

June 12, 2024

Is META Breaking Out or Breaking Down?

July 24, 2025

From Drift to Lift: Spotting Breakouts Before Momentum...

June 27, 2025

Why Technical Analysis Does NOT Work for Leveraged...

June 22, 2024

Nvidia Plunges Over 6% to Mark the End...

June 26, 2024

Growth Stocks Tumbling; Where to Find Safe Havens...

March 1, 2025

S&P 500 Slide Explained: What Past Price Action...

May 23, 2025

    Get free access to all of the retirement secrets and income strategies from our experts! or Join The Exclusive Subscription Today And Get the Premium Articles Acess for Free


    By opting in you agree to receive emails from us and our affiliates. Your information is secure and your privacy is protected.

    Recent

    • Obama wanted shutdown pain to be felt by Americans, while Trump kept focus on Washington, experts argue

      November 24, 2025
    • Trump admin disputes claim that Ukraine peace plan was Russia ‘wish list’

      November 24, 2025
    • Trump orders Epstein files release, welcomes Mamdani, crown prince to White House in busy week

      November 24, 2025
    • Vindman’s call to release Trump–MBS transcript reopens old questions in US-Saudi relationship

      November 24, 2025
    • Former TV anchor heads to same prison as Ghislaine Maxwell after $63M COVID fraud conviction

      November 24, 2025

    Categories

    • Business (1,136)
    • Investing (3,547)
    • Politics (4,328)
    • Stocks (1,155)
    • About us
    • Contact us
    • Privacy Policy
    • Terms & Conditions

    Disclaimer: sportinvestorsleague.com, its managers, its employees, and assigns (collectively “The Company”) do not make any guarantee or warranty about what is advertised above. Information provided by this website is for research purposes only and should not be considered as personalized financial advice. The Company is not affiliated with, nor does it receive compensation from, any specific security. The Company is not registered or licensed by any governing body in any jurisdiction to give investing advice or provide investment recommendation. Any investments recommended here should be taken into consideration only after consulting with your investment advisor and after reviewing the prospectus or financial statements of the company.

    Copyright © 2025 sportinvestorsleague.com | All Rights Reserved