Sport Investors League
  • Politics
  • Stocks
  • Investing
  • Business

Sport Investors League

  • Politics
  • Stocks
  • Investing
  • Business
Stocks

Visualizing the Holdings for a Dual Momentum Rotation Strategy

by admin June 4, 2024
June 4, 2024
Visualizing the Holdings for a Dual Momentum Rotation Strategy

As the name suggests, Dual Momentum Rotation Strategies focus on stocks that are in absolute and relative uptrends. This is a two-step process. First, filter out stocks that are in long-term downtrends and only focus on stocks in uptrend. Second, rank the stocks by a performance indicator and focus on the strongest. Note that TrendInvestorPro runs two Dual Momentum Rotation Strategies.

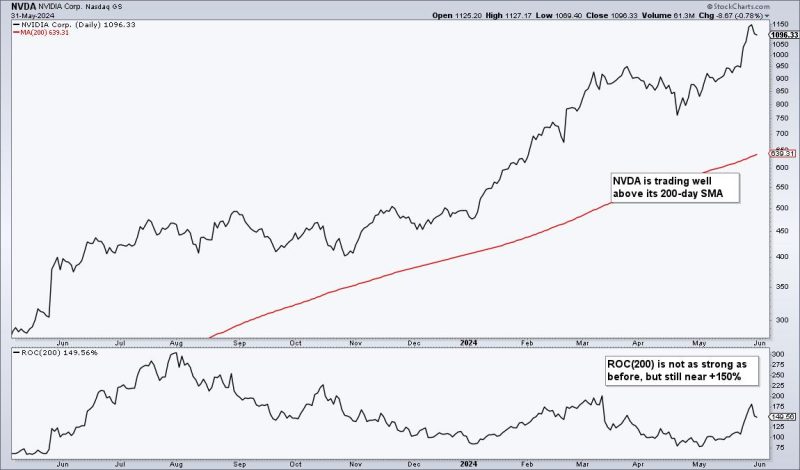
Traditional trend-following indicators, such as the 200-day SMA, measure absolute momentum. For example, a stock is in a long-term uptrend when above its 200-day SMA. Stocks trading below their 200-day SMAs are in long-term downtrends and do not make the cut for the second step.

For stocks in long-term uptrends, chartists can then quantify performance using the 200-day Rate-of-Change and comparing values to find the strongest. A stock with a 49% Rate-of-Change is stronger than a stock with a 19% Rate-of-Change.

The image below shows CandleGlance charts for the top Nasdaq 100 stocks. They are ranked by the 200-day Rate-of-Change (ROC(200)). “Add indicator” is Rate-of-Change 200 and “Sort by Indicator” is Descending (red outline). These 12 are also above their 200-day SMAs (red lines) and in long-term uptrends.

As the green ovals show, Nvidia (NVDA), Crowdstrike (CRWD) and Constellation (CEG) are up over 100% the last 200 days and the other nine are up 50% or more. Chartists running a Dual Momentum Rotation Strategy would be focused on these leading names when constructing a portfolio. Strength begets strength.

We use a similar process for our Dual Momentum Rotation Strategies at TrendInvestorPro. Instead of raw Rate-of-Change, we use a volatility-adjust version to level the playing field. NVDA, CRWD and CEG are part of the current portfolio for the Nasdaq 100 strategy. We also have a separate strategy for S&P 500 stocks. Both strategies are off to a great start this year and you can view full performance metrics here.

///////////////////////////////////

0
FacebookTwitterGoogle +Pinterest
previous post
DP Trading Room: Upside Initiation Climax (Should We Trust It?)
next post
A Practical Options Strategy to Trade Home Depot

Related Posts

This MUST SEE MACD Pattern is a Game...

May 30, 2024

Will This Sector Rotation Be The Start Of...

July 19, 2024

Equities Remain in Strong “Go” Trend as Tech...

December 10, 2024

SHOP Stock Ready to Surge: An Options Strategy...

September 19, 2024

Best Bullish and Bearish OptionsPlay Ideas for the...

December 3, 2024

Stay Away from Large-Cap Value Stocks

December 7, 2024

The Sign of Strong Charts Getting Stronger

November 15, 2024

S&P 500 Equal Weight ETF Gains Strength

August 1, 2024

Stock Market Panic: Why Strong Jobs and Inflation...

January 11, 2025

This Is What I Mean By Leading Stocks...

May 10, 2024

    Get free access to all of the retirement secrets and income strategies from our experts! or Join The Exclusive Subscription Today And Get the Premium Articles Acess for Free


    By opting in you agree to receive emails from us and our affiliates. Your information is secure and your privacy is protected.

    Recent

    • Strategic Chaos or Tactical Goldmine? What QQQ’s Chart is Whispering Right Now

      June 5, 2025
    • Why ADX Can Mislead You — And How to Avoid It

      June 5, 2025
    • S&P 500 on the Verge of 6,000: What’s at Stake?

      June 5, 2025
    • Speaker Johnson surprised by Musk’s criticism of ‘big, beautiful bill’: He’s ‘flat wrong’

      June 5, 2025
    • There’s a way to aid Gaza. I know, my foundation just helped deliver 7 million meals… without incident

      June 5, 2025

    Categories

    • Business (967)
    • Investing (2,320)
    • Politics (2,873)
    • Stocks (1,054)
    • About us
    • Contact us
    • Privacy Policy
    • Terms & Conditions

    Disclaimer: sportinvestorsleague.com, its managers, its employees, and assigns (collectively “The Company”) do not make any guarantee or warranty about what is advertised above. Information provided by this website is for research purposes only and should not be considered as personalized financial advice. The Company is not affiliated with, nor does it receive compensation from, any specific security. The Company is not registered or licensed by any governing body in any jurisdiction to give investing advice or provide investment recommendation. Any investments recommended here should be taken into consideration only after consulting with your investment advisor and after reviewing the prospectus or financial statements of the company.

    Copyright © 2025 sportinvestorsleague.com | All Rights Reserved